Appearance
Insights Dashboard
The Insights Dashboard gives you a comprehensive view of your business performance. Track key metrics, understand trends, and make data-driven decisions about your field service operations.
Accessing Insights
Go to Insights in the main navigation to view your dashboard.
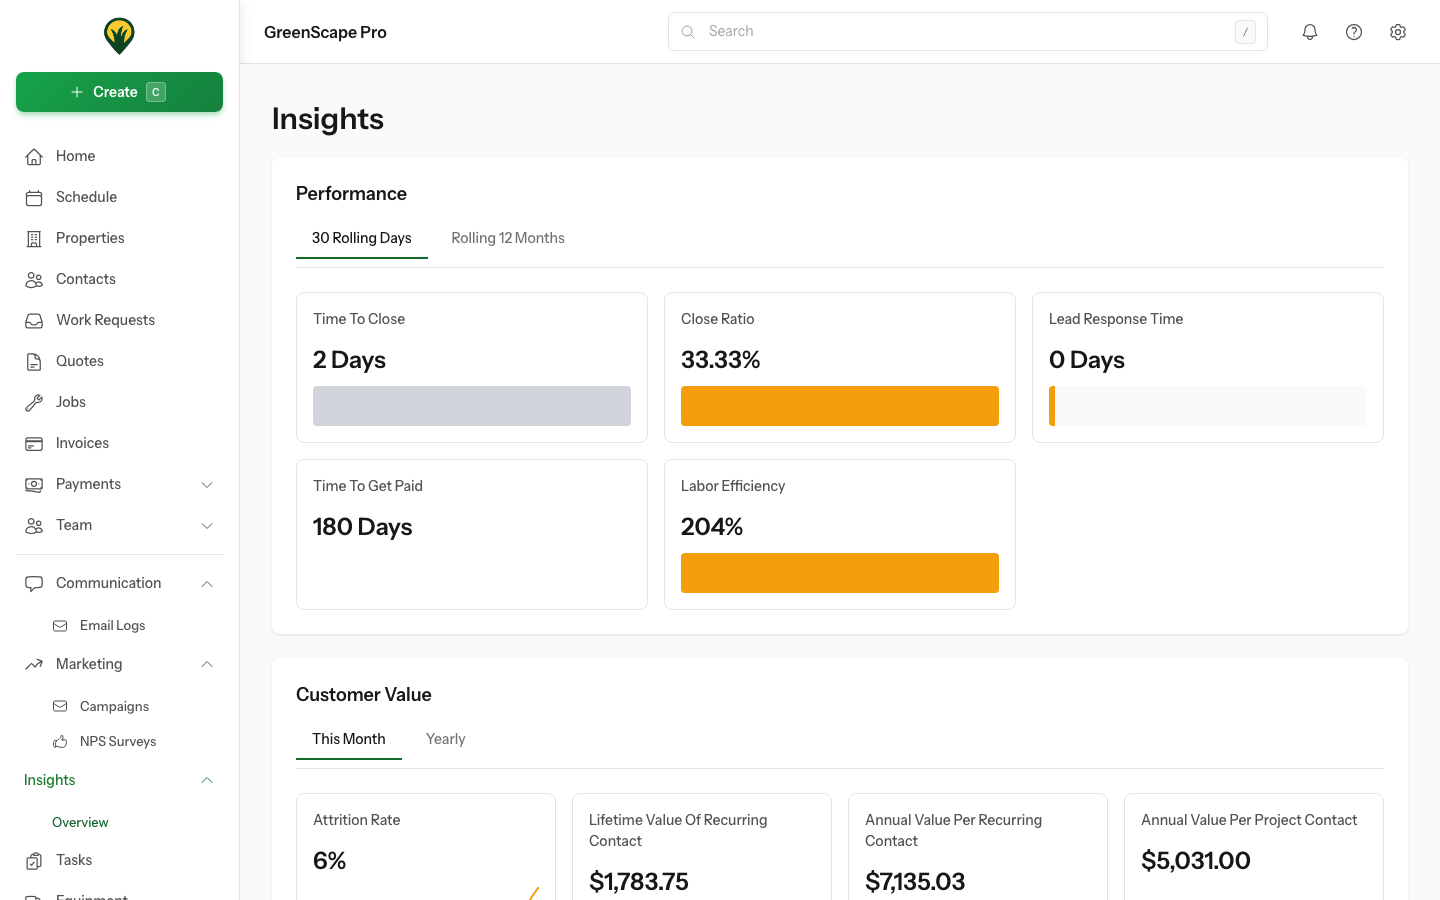
Click to enlarge
Performance Metrics
The Performance section shows key operational metrics for your business.
Time Periods
Toggle between different time periods:
- 30 Rolling Days - Recent performance
- Rolling 12 Months - Long-term trends
Available Metrics
| Metric | What It Measures | Goal |
|---|---|---|
| Time To Close | Days from quote sent to job won | Lower is better |
| Close Ratio | Percentage of quotes that convert to jobs | Higher is better |
| Lead Response Time | Time to respond to new work requests | Lower is better |
| Time To Get Paid | Days from invoice sent to payment received | Lower is better |
| Labor Efficiency | Budgeted time vs actual time on jobs | Higher is better |
Reading the Charts
Each metric shows:
- Current value - The headline number
- Trend chart - Visual representation over time
Understanding Labor Efficiency
A labor efficiency of 100% means jobs are completed in exactly the budgeted time. Above 100% means crews are working faster than estimated; below 100% means jobs are taking longer than planned.
Customer Value Metrics
Understand the value your customers bring to your business.
Time Periods
Toggle between:
- This Month - Current month performance
- Yearly - Annual averages
Available Metrics
| Metric | What It Measures |
|---|---|
| Attrition Rate | Percentage of customers who stop using your services |
| Lifetime Value of Recurring Contact | Total expected revenue from a recurring customer |
| Annual Value Per Recurring Contact | Yearly revenue from recurring customers |
| Annual Value Per Project Contact | Yearly revenue from project-based customers |
Understanding Attrition
A lower attrition rate means:
- Better customer retention
- More predictable revenue
- Higher lifetime customer value
Track this metric monthly to identify trends and take action before losing valuable customers.
Schedule Metrics
View your scheduled workload and revenue:
| Column | Description |
|---|---|
| Period | Time frame (this week, next week, this month) |
| Budgeted Hours | Total scheduled work hours |
| Revenue | Expected revenue from scheduled work |
This helps with:
- Capacity planning
- Resource allocation
- Cash flow forecasting
Service Area
Visualise your service coverage:
- Distance - Average travel distance to jobs
- Radius - Geographic spread of your customer base
Use this to:
- Identify expansion opportunities
- Optimise routing
- Understand travel costs
Team Capacity
Track your team's capacity:
| Metric | Description |
|---|---|
| # of Employees | Total field workers |
| # of BH/Employees | Budgeted hours per employee |
| BH Per Week Capacity | Total weekly capacity in hours |
Capacity Planning
Compare your:
- Total capacity (BH Per Week)
- Scheduled work (from Schedule Metrics)
If scheduled work is approaching capacity, consider:
- Hiring additional staff
- Adjusting schedules
- Subcontracting overflow
Booking Forecast
The Booking Chart shows future workload by week:
- Visual timeline of booked work
- Booked Out Until indicator shows how far ahead you're scheduled
Interpreting the Forecast
| Scenario | What It Means |
|---|---|
| Consistent bars | Stable, predictable workload |
| Declining bars | Work tapering off, need more leads |
| Growing bars | Building pipeline, good sign |
| Gaps | Unscheduled time, capacity available |
Revenue Metrics
Revenue by Service
See which services generate the most income (trailing 12 months).
Key Revenue Metrics
| Metric | Description |
|---|---|
| Effective Rate | Actual revenue per hour worked |
| Average Project Size | Mean value of one-off jobs |
| Average Recurring Size | Mean value of recurring service contracts |
| Month Revenue | Monthly revenue trend |
Recurring vs Project Revenue
The donut chart shows the split between:
- Recurring revenue - Stable, predictable income
- Project revenue - One-off job income
Healthy Revenue Mix
Most successful field service businesses aim for 60-80% recurring revenue. This provides stability while project work adds growth opportunities.
Using Insights Effectively
Weekly Review
Check these metrics weekly:
- Lead Response Time (should stay low)
- Close Ratio (watch for dips)
- Team Capacity vs Schedule
Monthly Review
Review these monthly:
- Attrition Rate (identify churn early)
- Customer Value metrics
- Revenue trends
- Labor Efficiency
Quarterly Review
Deep dive quarterly on:
- Service Area changes
- Revenue mix (recurring vs project)
- Booking Forecast trends
- Overall business health
Data Freshness
Insights are calculated from your YardPilot data:
- Most metrics update in real-time
- Some aggregate metrics refresh daily
- Historical data is always available
Troubleshooting
"No Records" Displayed
This appears when:
- You're new to YardPilot and don't have enough data yet
- The selected period has no activity
- Filters are excluding all results
Keep using YardPilot and data will populate over time.
Metrics Look Wrong
If metrics seem incorrect:
- Check your job and invoice data is complete
- Ensure visits have proper time tracking
- Verify invoices are marked as paid when received
Loading Issues
If the dashboard won't load:
- Refresh the page
- Check your internet connection
- Try a different browser
- Contact support if issues persist
Permissions
| Role | View Insights |
|---|---|
| Owner | ✓ |
| Admin | ✓ |
| Office | ✓* |
| Field | ✗ |
*Office workers may have view access depending on their permissions.
Owner Independence Dashboard
For business owners looking to build a self-sustaining operation, the Owner Independence Dashboard provides a comprehensive score measuring how well your business can run without daily owner involvement.
The dashboard tracks five key categories:
- Team Productivity - Labor utilisation, revenue per hour
- Financial Health - Margins, cash flow, growth
- Sales Pipeline - Conversion rates, deal size
- Service Quality - First-time fix rate, on-time arrival
- Customer Health - Churn, NPS, repeat customers
Feature Access
Owner Independence is available to accounts with this feature enabled. Contact support if you don't see it in your Insights menu.
Next Steps
- Owner Independence Dashboard - Track your path to owner freedom
- Set up rostering to track capacity accurately
- Enable time tracking for labor efficiency data
- Create recurring jobs to build recurring revenue